Statewide Employment and Wages Increased as Virginia Outperforms National Averages
RICHMOND— Virginia Works – the Commonwealth’s Department of Workforce Development and Advancement – announced the publication of 2024 Virginia Occupational Employment and Wage Statistics (OEWS) data on Wednesday.
Total statewide employment for all occupations was an estimated 4,064,640 in 2024, a 2.1% increase from 2023’s total employment of 3,981,130. Wages in Virginia also increased during this period, with the mean annual wage growing by 2.9% to $72,060 and the median annual wage growing by 6.2% to $53,020. Virginia’s mean annual wage was 6.1% higher than the United States’ mean annual wage of $67,920, with Virginia’s median annual wage also larger than the United States’ $49,500 by 7.1%.
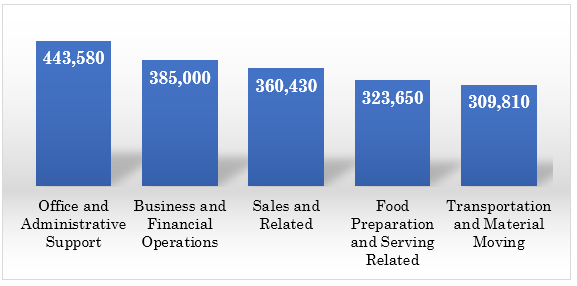
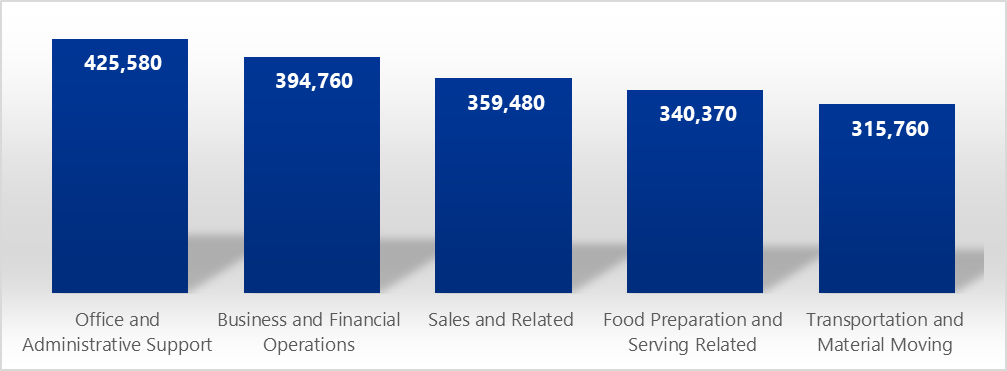
Figure 1 below displays the top five major occupational groups in Virginia by employment. Office and Administrative Support remains the largest statewide occupational group, with over 10% of Virginians employed in those occupations. Employment is largely concentrated not only in that group, but also in Business and Financial Operations Occupations and Sales and Related Occupations, with approximately 29% of statewide employment falling into one of these three categories. In terms of median annual wage, Business and Financial Operations Occupations rank relatively high among occupation groups with a median annual wage of $92,050 while the remaining four out of five top employing occupational groups have a median annual wage below that of the state overall ($53,020).
Figure 1: Top 5 Major Occupation Groups by Employment
The largest detailed occupations in the state were Fast Food and Counter Workers (103,390 employed), Retail Salespersons (101,260), and General and Operations Managers (99,710). Figure 2 outlines detailed statistics on the top five detailed occupations in the state.
Figure 2: Top 5 Detailed Occupations by Employment
| Detailed Occupation | Employment | Mean Hourly Wage | Median Hourly Wage | Mean Annual Wage | Median Annual Wage |
| Fast Food and Counter Workers | 103,390 | $14.85 | $13.97 | $30,890 | $29,060 |
| Retail Salespersons | 101,260 | $17.48 | $15.75 | $36,350 | $32,760 |
| General and Operations Managers | 99,710 | $67.35 | $58.43 | $140,090 | $121,530 |
| Cashiers | 84,500 | $15.03 | $14.35 | $31,260 | $29,840 |
| Software Developers | 83,290 | $68.38 | $64.65 | $142,230 | $134,470 |
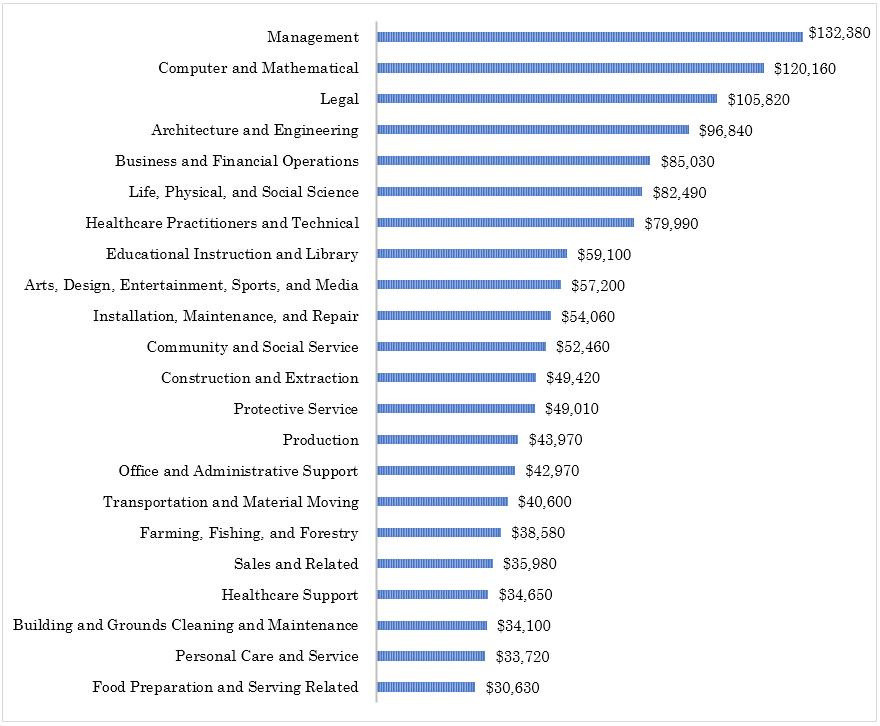
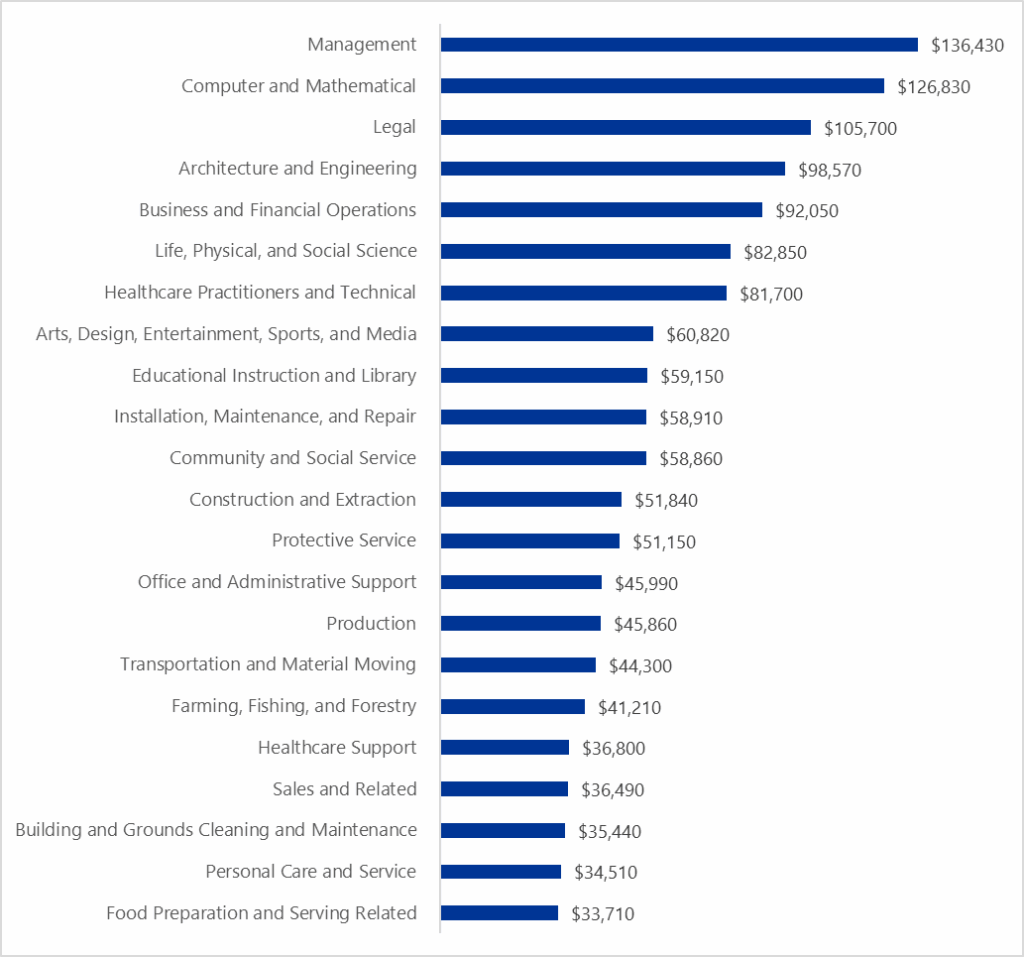
Figure 3 graphs statewide median salary by major occupation group. The highest median salary was for Management Occupations at $136,430 (over two and a half times the state’s median salary for all occupations), followed by Computer and Mathematical Occupations at $126,830 and Legal Occupations at $105,700. The lowest median salary reported was for Food Preparation and Serving Related Occupations at $33,710, followed by Personal Care and Service Occupations at $34,510 and Building and Grounds Cleaning and Maintenance Occupations at $35,440.
Figure 3: Median Salary by Major Occupation Group
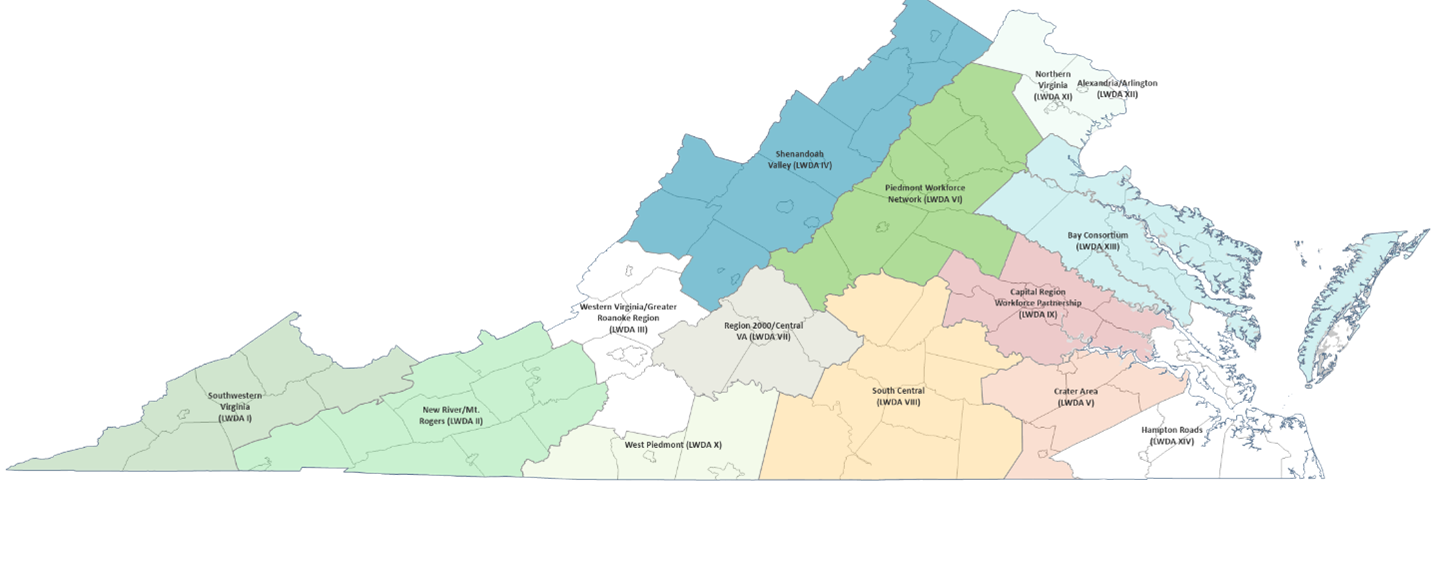
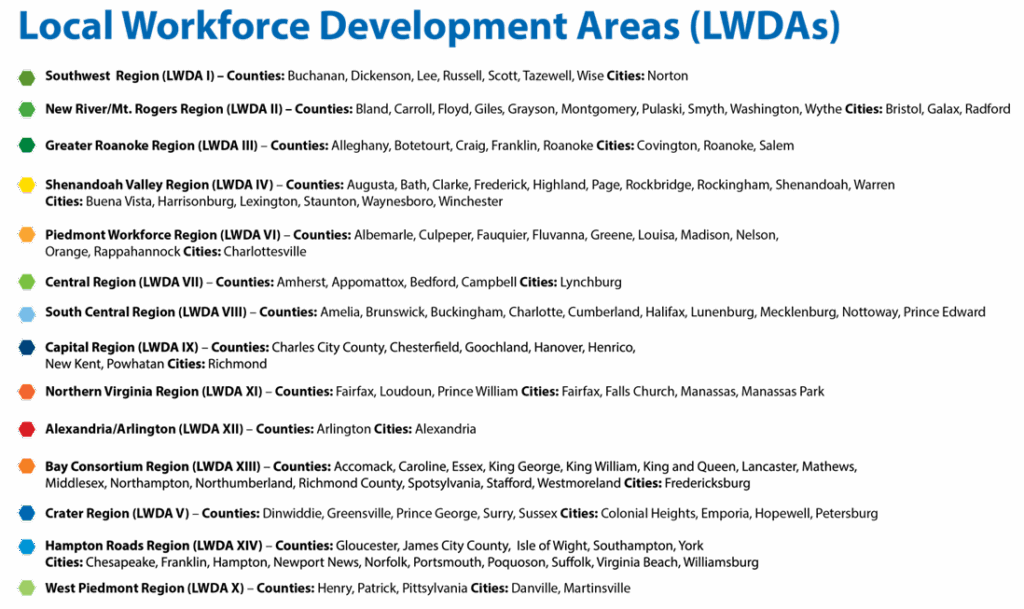
It is important to consider employment and wage trends across regions of Virginia. Figure 4 gives employment and wage statistics for Virginia’s fourteen Local Workforce Development Areas (map shown in Appendix B). As expected, the regions with the highest employment were the Northern Region (1,032,120), the Hampton Roads Region (748,660), and the Capital Region (588,240). The Alexandria/Arlington Region had the highest wages with a mean annual wage of $102,380 and a median wage of $81,620. The West Piedmont Region had the lowest wages with a mean annual wage of $51,130 and a median annual wage of $41,530.
Figure 4: Employment and Wages by Local Workforce Development Are
| Local Workforce Development Area (LWDA) | Employment | Mean Hourly Wage | Median Hourly Wage | Mean Annual Wage | Median Annual Wage |
| Southwest Region (LWDA I) | 52,960 | $25.80 | $21.27 | $53,670 | $44,230 |
| New River/Mount Rogers Region (LWDA II) | 145,370 | $26.31 | $21.59 | $54,730 | $44,920 |
| Greater Roanoke Region (LWDA III) | 159,160 | $27.41 | $22.12 | $57,010 | $46,020 |
| Shenandoah Valley Region (LWDA IV) | 233,050 | $27.31 | $22.27 | $56,800 | $46,320 |
| Piedmont Region (LWDA VI) | 176,180 | $32.70 | $24.38 | $68,010 | $50,700 |
| Central Region (LWDA VII) | 97,210 | $27.08 | $21.85 | $56,330 | $45,440 |
| South Central Region (LWDA VIII) | 53,160 | $25.60 | $21.42 | $53,250 | $44,550 |
| Capital Region (LWDA IX) | 588,240 | $32.11 | $24.20 | $66,790 | $50,330 |
| Northern Region (LWDA XI) | 1,032,120 | $41.83 | $30.81 | $87,010 | $64,080 |
| Alexandria/Arlington Region (LWDA XII) | 260,760 | $49.22 | $39.24 | $102,380 | $81,620 |
| Bay Consortium Region (LWDA XIII) | 171,220 | $31.88 | $23.43 | $66,310 | $48,730 |
| Crater Region (LWDA V) | 66,530 | $28.82 | $23.45 | $59,940 | $48,780 |
| Hampton Roads Region (LWDA XIV) | 748,660 | $30.14 | $23.28 | $62,700 | $48,420 |
| West Piedmont Region (LWDA X) | 66,550 | $24.58 | $19.96 | $51,130 | $41,530 |
Detailed statistics by major occupational group are shown in Appendix A. Appendix C provides an overview of the top three major occupational groups and top three detailed occupations by LWDA. Full data accompanies this release and may also be accessed at this link and downloaded here.
Appendix A: 2024 Statewide Employment and Wages of Major Occupational Groups
| Major Occupation Group | Employment | Average Hourly Wage | Median Hourly Wage | Average Annual Wage | Median Annual Wage |
| Total, All Occupations | 4,064,640 | $34.64 | $25.49 | $72,060 | $53,020 |
| Management | 261,140 | $73.90 | $65.59 | $153,710 | $136,430 |
| Business and Financial Operations | 394,760 | $48.66 | $44.26 | $101,210 | $92,050 |
| Computer and Mathematical | 238,320 | $61.48 | $60.98 | $127,880 | $126,830 |
| Architecture and Engineering | 74,160 | $50.60 | $47.39 | $105,260 | $98,570 |
| Life, Physical, and Social Science | 44,310 | $48.20 | $39.83 | $100,250 | $82,850 |
| Community and Social Service | 61,410 | $30.37 | $28.30 | $63,170 | $58,860 |
| Legal | 35,540 | $64.35 | $50.82 | $133,840 | $105,700 |
| Educational Instruction and Library | 249,680 | $31.67 | $28.44 | $65,880 | $59,150 |
| Arts, Design, Entertainment, Sports, and Media | 58,950 | $33.76 | $29.24 | $70,220 | $60,820 |
| Healthcare Practitioners and Technical | 228,840 | $48.83 | $39.28 | $101,570 | $81,700 |
| Healthcare Support | 155,140 | $18.71 | $17.69 | $38,910 | $36,800 |
| Protective Service | 110,470 | $28.33 | $24.59 | $58,920 | $51,150 |
| Food Preparation and Serving Related | 340,370 | $17.87 | $16.21 | $37,160 | $33,710 |
| Building and Grounds Cleaning and Maintenance | 127,170 | $17.92 | $17.04 | $37,270 | $35,440 |
| Personal Care and Service | 90,420 | $18.90 | $16.59 | $39,310 | $34,510 |
| Sales and Related | 359,480 | $25.53 | $17.54 | $53,110 | $36,490 |
| Office and Administrative Support | 425,580 | $23.90 | $22.11 | $49,710 | $45,990 |
| Farming, Fishing, and Forestry | 5,010 | $22.29 | $19.81 | $46,370 | $41,210 |
| Construction and Extraction | 171,980 | $27.65 | $24.92 | $57,520 | $51,840 |
| Installation, Maintenance, and Repair | 156,110 | $29.80 | $28.32 | $61,990 | $58,910 |
| Production | 160,020 | $23.90 | $22.05 | $49,710 | $45,860 |
| Transportation and Material Moving | 315,760 | $24.53 | $21.30 | $51,010 | $44,300 |
Appendix B: Map of Local Workforce Development Are

Appendix C: Top Occupations by Employment by Local Workforce Development Area
| Local Workforce Development Area (LWDA) | Top 3 Major Occupational Groups (employment) | Top 3 Detailed Occupations (employment) |
| Southwest Region (LWDA I) | 1) Office and Administrative Support (6,110) 2) Sales and Related (5,040) 3) Educational Instruction and Library (4,990) | 1) Cashiers (2,090) 2) Fast Food and Counter Workers (1,680) 3) Stockers and Order Fillers (1,380) |
| New River/Mount Rogers Region (LWDA II) | 1) Production (15,570) 2) Office and Administrative Support (15,080) 3) Food Preparation and Serving Related (13,690) | 1) Fast Food and Counter Workers (4,290) 2) Cashiers (4,050) 3) Retail Salespersons (3,510) |
| Greater Roanoke Region (LWDA III) | 1) Office and Administrative Support (18,250) 2) Sales and Related (14,880) 3) Transportation and Material Moving (14,520) | 1) Registered Nurses (6,120) 2) Retail Salespersons (4,500) 3) Fast Food and Counter Workers (3,670) |
| Shenandoah Valley Region (LWDA IV) | 1) Transportation and Material Moving (28,400) 2) Office and Administrative Support (24,350) 3) Food Preparation and Serving Related Occupations (21,860) | 1) Fast Food and Counter Workers (7,040) 2) Retail Salespersons (6,520) 3) Stockers and Order Fillers (6,170) |
| Crater Region (LWDA V) | 1) Transportation and Material Moving (8,820) 2) Office and Administrative Support (6,290) 3) Food Preparation and Serving Related (5,910) | 1) Heavy and Tractor-Trailer Truck Drivers (2,020) 2) Cashiers (1,960) 3) Fast Food and Counter Workers (1,930) |
| Piedmont Region (LWDA VI) | 1) Office and Administrative Support (17,760) 2) Educational Instruction and Library (17,070) 3) Food Preparation and Serving Related (16,970) | 1) Fast Food and Counter Workers (4,770) 2) Retail Salespersons (4,370) 3) Cashiers (4,020) |
| Central Region (LWDA VII) | 1) Office and Administrative Support (10,250) 2) Sales and Related (10,050) 3) Food Preparation and Serving Related (9,580) | 1) Retail Salespersons (3,480) 2) Fast Food and Counter Workers (3,280) 3) Cashiers (2,530) |
| South Central Region (LWDA VIII) | 1) Transportation and Material Moving (5,830) 2) Office and Administrative Support (5,780) 3) Sales and Related (4,810) | 1) Cashiers (1,740) 2) Heavy and Tractor-Trailer Truck Drivers (1,440) 3) Fast Food and Counter Workers (1,360) |
| Capital Region (LWDA IX) | 1) Office and Administrative Support (70,930) 2) Business and Financial Operations (55,440) 3) Sales and Related (53,870) | 1) Fast Food and Counter Workers (15,020) 2) Retail Salespersons (14,530) 3) Registered Nurses (14,080) |
| West Piedmont Region (LWDA X) | 1) Production (7,800) 2) Office and Administrative Support (7,500) 3) Transportation and Material Moving (6,910) | 1) Cashiers (1,990) 2) Fast Food and Counter Workers (1,850) 3) Retail Salespersons (1,740) |
| Northern Region (LWDA XI) | 1) Business and Financial Operations (126,140) 2) Computer and Mathematical (103,610) 3) Office and Administrative Support (95,130) | 1) Software Developers (39,680) 2) General and Operations Managers (29,310) 3) Management Analysts (25,860) |
| Alexandria/Arlington Region (LWDA XII) | 1) Business and Financial Operations (49,520) 2) Computer and Mathematical (28,530) 3) Management (27,960) | 1) Management Analysts (12,040) 2) Software Developers (9,200) 3) General and Operations Managers (9,050) |
| Bay Consortium Region (LWDA XIII) | 1) Sales and Related (17,820) 2) Office and Administrative Support (16,930) 3) Food Preparation and Serving Related (16,790) | 1) Fast Food and Counter Workers (5,600) 2) Cashiers (5,460) 3) Retail Salespersons (5,350) |
| Hampton Roads Region (LWDA XIV) | 1) Office and Administrative Support (80,290) 2) Food Preparation and Serving Related (74,070) 3) Sales and Related (67,670) | 1) Fast Food and Counter Workers (22,230) 2) Retail Salespersons (20,890) 3) Cashiers (17,160) |
| This Federal-State cooperative program provides annual estimates of employment and wages for approximately 800 occupations in 22 major occupational groups based on a survey of business establishments. Occupations are classified using the Standard Occupational Classification (SOC) system, which organizes jobs into a hierarchy from 2-digit major occupation groups to detailed 6-digit occupations. The OEWS survey covers wage and salary workers in nonfarm and nonmilitary establishments and does not include the self-employed, owners and partners in unincorporated firms, household workers, or unpaid family workers. In collaboration with the Bureau of Labor Statistics (BLS), Virginia Works releases comprehensive data covering the entire state, as well as Virginia’s Balance of State (BOS) regions and Metropolitan Statistical Areas (MSAs). An industry breakdown is available for this data according to North American Industry Classification System (NAICS) codes. Additionally, utilizing modeling from the Local Employment and Wage Information System (LEWIS), Virginia Works generates estimates for Local Workforce Development Areas (LWDAs) and Planning Regions (PDCs). |
Technical Notes:
Virginia Works has provided several extensions to the official OEWS data series which have been developed in cooperation with the Bureau of Labor Statistics (BLS). These additional products have not been validated by BLS and are not, therefore, official BLS data series.
Two of these additional products are the “entrywg” and “experience” fields. Virginia Works has used the Local Employment and Wage Information System (LEWIS) to calculate entry-level wage rates as the mean of the bottom third of the wage distribution, and experienced-level wage rates as the mean of the top two-thirds of the wage distribution. Data on experience level were not collected as part of the OEWS Survey, and the data contained in this report have not been validated by BLS and are not, therefore, official BLS data series.
Other products provided by Virginia Works which are not official BLS data series include OEWS estimates for Local Workforce Development Areas (LWDAs) and Planning Regions (PDCs). These sub-state employment and wage estimates have been produced using the Local Employment and Wage Information System (LEWIS) and have not been validated by BLS.
Please note that for statewide estimates, employment levels below 100 have been excluded. For sub-state estimates, employment levels below 30 have been excluded. Other suppressions have been applied to estimates across all area types according to BLS guidelines. More technical information may be found at this link: https://www.bls.gov/oes/current/oes_tec.htm