- Virginia’s Latest Unemployment Insurance Weekly Initial Claims at 2,274; Continued Claims at 20,592
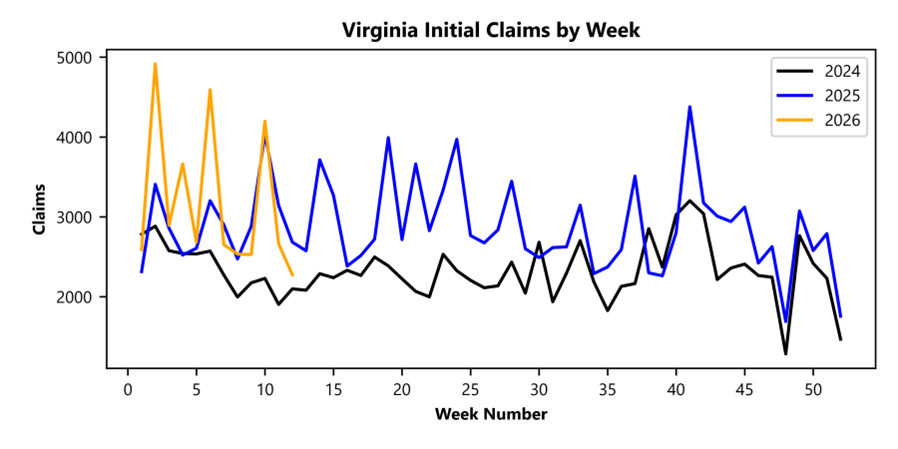
RICHMOND— Virginia Works’ Economic Information and Analytics Division, which serves as the Commonwealth’s official source for labor market and workforce data, reported that that 2,274 unemployment insurance weekly initial claims were filed during the week ending March 21, 2026. The claims were filed with the Virginia Employment Commission, which administers the Commonwealth’s Unemployment Insurance program. This is 14.6 percent lower than last week’s 2,662 claims and 15.2 percent lower than the comparable week of last year (2,683). Nearly 78 percent of claimants self-reported an employer which correlates to an associated industry. Based on this reporting, the top five industries (58 percent) were Professional, Scientific, and Technical Services (276); Administrative and Support and Waste Management (196); Health Care and Social Assistance (188); Retail Trade (167); and Manufacturing (153).
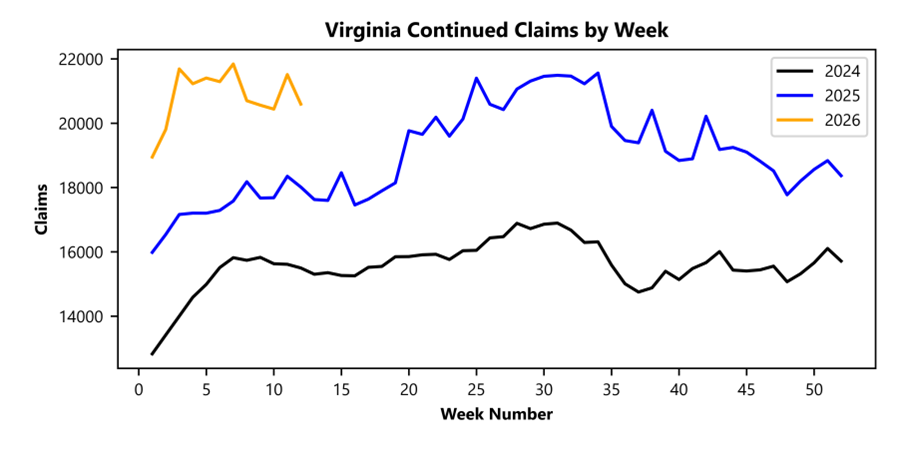
Continued weeks’ claims (20,592) were 4.3 percent lower than last week (21,511) and were 14.3 percent higher than the comparable week of last year (18,013). Nearly 92 percent of claimants self-reported an employer which correlates to an associated industry. Based on this reporting, the top five industries (59 percent) were Professional, Scientific, and Technical Services (3,935); Administrative and Support and Waste Management (2,284); Manufacturing (1,852); Health Care and Social Assistance (1,739); and Retail Trade (1,468).
Significant Layoffs and Announcements are available at the following websites:
Announcements | Virginia Economic Development Partnership
Unemployment Claims Activity Comparison
Week Ending
03/21/2026Week Ending
03/14/2026Week Ending
03/07/2026Last Year
03/22/2025Initial Claims
2,274
2,662
4,198
2,683
Initial Change (%)
-388 (-14.6%)
-1,536 (-36.6%)
+1,670 (+66.1%)
-409 (-15.2%)
Continued Claims
20,592
21,511
20,437
18,013
Continued Change (%)
-919 (-4.3%)
+1,074 (+5.3%)
-123 (-0.6%)
+2,579 (+14.3%)
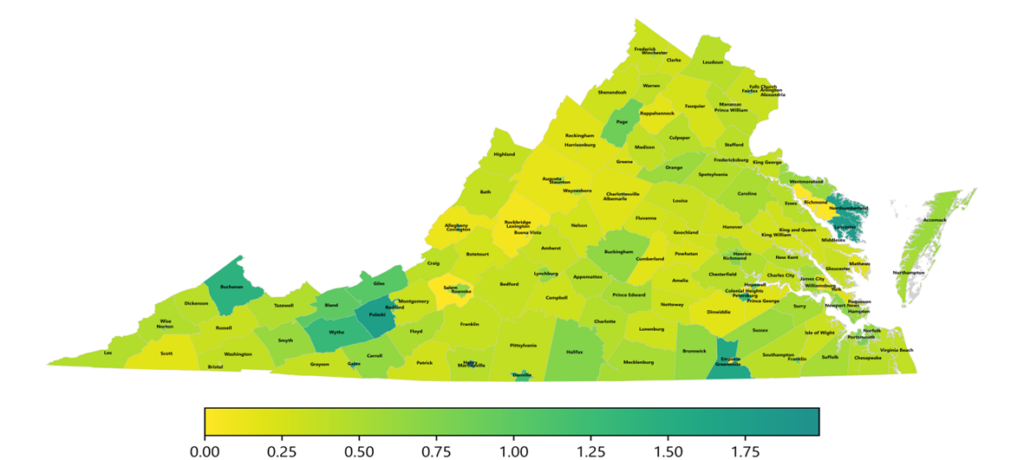
Virginia Continued Weeks Claimed as a Percentage of Total Workforce
A person who has already filed an initial claim and who has experienced a week of unemployment files a continued claim to claim benefits for that week of unemployment. On a weekly basis, continued claims reflect a good approximation of the current number of insured unemployed workers filing for UI benefits, and are a good indicator of labor market conditions. While continued claims are not a leading indicator, they provide confirming evidence of the direction of the economy.
The color-coded map below shows the distribution of this week’s continued claims in Virginia’s counties and cities, expressed as a percentage of each locality’s labor force. This approach provides a more meaningful comparison across areas by adjusting for differences in labor force size. Yellow represents a lower percentage of continued claims relative to the labor force, while progressively darker shades transitioning from yellow to green and dark green indicate higher percentages. The legend at the bottom shows the color spectrum and its corresponding percentage ranges.
 PDF of Press Release