April 17, 2025
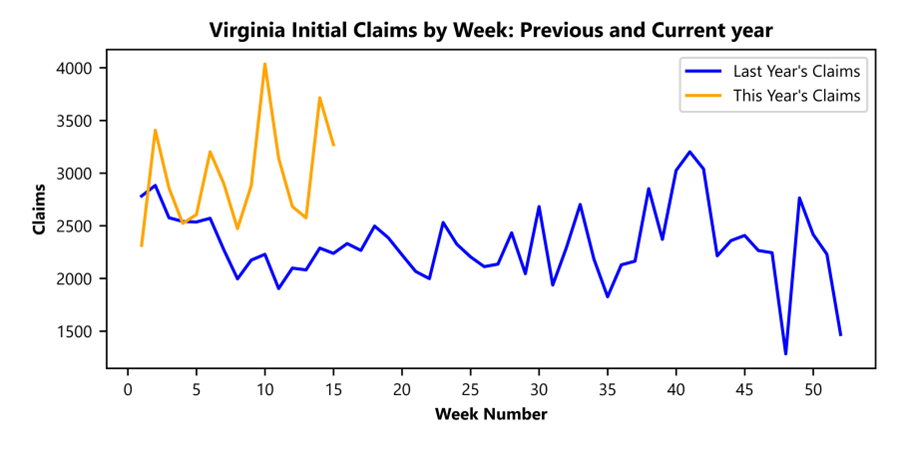
RICHMOND— Virginia Works announced today that 3,270 unemployment insurance weekly initial claims were filed during the week ending April 12, 2025, which is 12.0 percent lower than last week’s 3,714 claims and 46.1 percent higher than the comparable week of last year (2,238). Nearly 68 percent of claimants self-reported an associated industry; of those reported, the top five industries (66 percent) were Professional, Scientific, and Technical Services (465); Administrative and Support and Waste Management (269); Retail Trade (246); Manufacturing (223); and Health Care and Social Assistance (209).
Continued weeks claims (18,459) were 4.9 percent higher than last week (17,598) and were 20.9 percent higher than the comparable week of last year (15,263). Nearly 92 percent of claimants self-reported an associated industry; of those reported, the top five industries (62 percent) were Professional, Scientific, and Technical Services (3,529); Administrative and Support and Waste Management (2,152); Manufacturing (1,848); Health Care and Social Assistance (1,566); and Retail Trade (1,398).
Significant Layoffs and Announcements are available at the following websites:
Announcements | Virginia Economic Development Partnership
| Initial Claims – Comparison of Unemployment Insurance Activity | ||||
| Week Ending 04/12/2025 | Week Ending 04/05/2025 | Week Ending 03/29/2025 | Last Year 04/13/2024 | |
| Initial Claims | 3,270 | 3,714 | 2,575 | 2,238 |
| Initial Change (%) | -444 (-12.0%) | +1,139 (+44.2%) | -108 (-4.0%) | +1,032 (+46.1%) |
| Continued Claims | 18,459 | 17,598 | 17,625 | 15,263 |
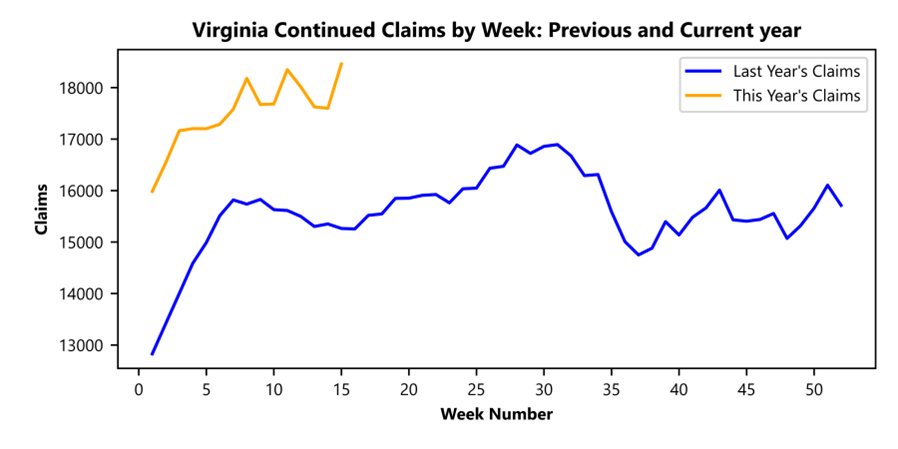
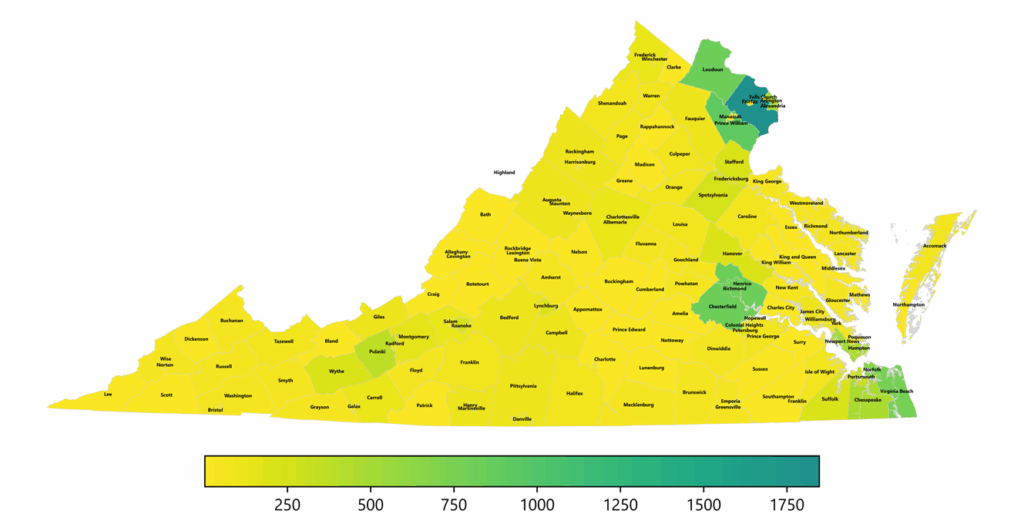
Virginia Continued Weeks Claimed
A person who has already filed an initial claim and who has experienced a week of unemployment files a continued claim to claim benefits for that week of unemployment. On a weekly basis, continued claims reflect a good approximation of the current number of insured unemployed workers filing for UI benefits, and are a good indicator of labor market conditions. While continued claims are not a leading indicator, they provide confirming evidence of the direction of the economy. The color-coded map below shows the distribution of this week’s continued claims for Virginia’s counties and cities. Yellow represents low numbers, while progressively darker shades transitioning from yellow to green and dark green signify increasing numbers of continued claims. The legend located at the bottom provides the color spectrum and its corresponding count of continued claims.
 PDF of Press Release